Unlocking Design Efficiency Through 3D Printing

As production cycles shorten and customization grows, companies need more agile, cost-effective, and scalable solutions to stay competitive. One technology that is consistently rising that meets these challenges is 3D printing. This article explores how 3D printing, and in particular Selective Laser Sintering (SLS), enables design efficiency and manufacturing flexibility for engineers, designers, and manufacturers. We will explain what 3D printing is, the unique capabilities of SLS, and offer practical insights on how these technologies can streamline production, reduce costs, and foster innovation in even the most demanding industries.
Understanding Additive Manufacturing
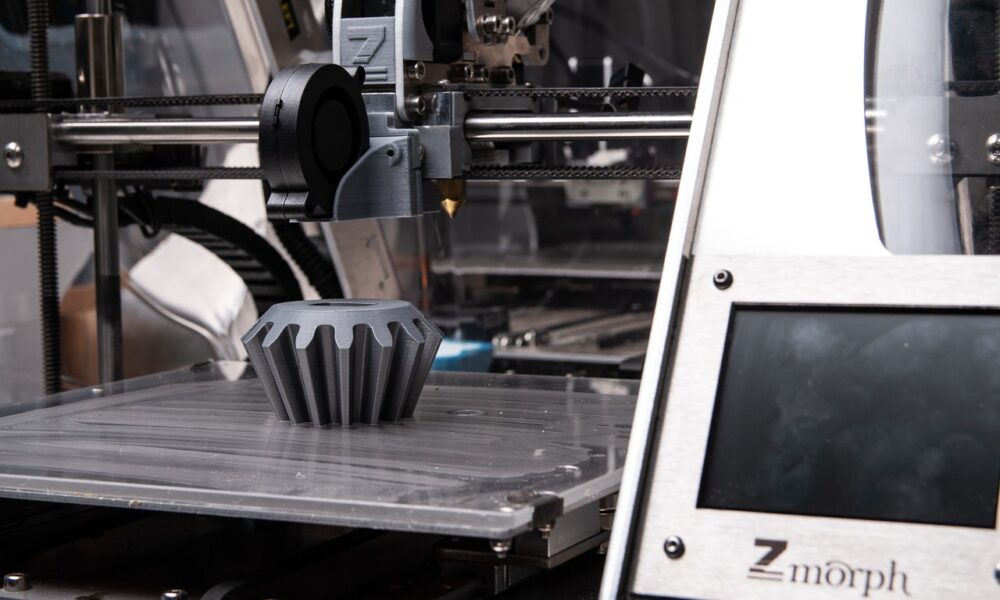
Understanding 3D printing is crucial before exploring its full potential. Also known as additive manufacturing, 3D printing is a process where objects are created layer by layer from a digital model, rather than being cut, drilled, or molded from bulk material. Unlike traditional manufacturing methods that often involve extensive tooling, subtractive processes, or long lead times, this technology allows for rapid prototyping, greater design freedom, and the ability to produce geometrically complex parts without additional cost penalties. It is a digital-first process, meaning changes to the design can be implemented quickly and efficiently, allowing for faster iteration and more agile development.
The Power of Selective Laser Sintering (SLS)
3D printing encompasses a range of techniques, one of the most popular and production-ready is Selective Laser Sintering (SLS). This method uses a high-powered laser to fuse powdered materials—usually polymers—into solid structures based on a 3D CAD model. Unlike some other 3D printing processes, SLS does not require support structures, allowing for greater design complexity and material efficiency. SLS is widely recognized for producing durable, lightweight, and functional parts suitable for both prototyping and end-use applications. Among its key advantages are its high dimensional accuracy, superior mechanical properties, and compatibility with a range of engineering-grade materials. These features make it a preferred solution for industries such as aerospace, automotive, healthcare, and consumer goods.
Driving Efficiency and Flexibility with SLS
Beyond its technical specifications, SLS enables new efficiencies in product development and manufacturing. Because the process eliminates the need for tooling and molds, it dramatically shortens lead times and reduces upfront costs. Teams can go from design to production within days, rather than weeks or months. SLS also supports batch production without the economies-of-scale limitations of traditional manufacturing. This opens the door for mass customization, rapid iteration, and on-demand manufacturing—capabilities increasingly essential in today’s market. With Selective Laser Sintering, designers and engineers can optimize parts for function rather than manufacturability, achieving lighter weights, reduced part counts, and integrated features without compromising structural integrity.
The Integrated Digital Ecosystem
Efficiency gains are also realized through the broader digital ecosystem surrounding 3D printing and SLS. Cloud-based CAD tools, simulation software, and automated quality assurance systems allow for a more integrated and intelligent workflow. Design for Additive Manufacturing (DfAM) practices, which encourage thinking beyond traditional constraints, empower teams to create parts that are more efficient, sustainable, and innovative. These tools and methodologies work in harmony with SLS to accelerate time to market, enhance product performance, and reduce waste. For companies looking to optimize their supply chains or implement just-in-time manufacturing strategies, the flexibility offered by SLS is invaluable.
Implementing SLS: A Phased Approach
For organizations considering the adoption of SLS and 3D printing technologies, a phased implementation strategy can help mitigate risk and maximize value. Start with internal prototyping to evaluate the material and mechanical properties of SLS-printed parts. Engage design teams in training sessions focused on DfAM principles to unlock the full potential of the technology. Collaborate with experienced additive manufacturing partners to scale production capabilities while maintaining consistent quality. Lastly, integrate additive manufacturing into digital transformation initiatives to ensure alignment with broader business goals. As the technology matures, companies that embrace SLS early will be better positioned to lead in their industries.
Summing Up
In short, the synergy of 3D printing and design efficiency is a powerful revolution in the manufacturing industry. Selective Laser Sintering is a revolutionary technology that combines the flexibility of digital design with the power of industrial-strength manufacturing. Through understanding and application of the advantages of SLS, product developers and manufacturers can break free from the limitations of conventional production methods. They can bring products to market faster, reduce costs, and respond more effectively to customer demands. As we seek to push the boundaries of what is possible in design and engineering, SLS will play a key role in shaping the next generation of manufacturing excellence.


